

Since 2000, the ASX 200 has climbed from just over 3,000 points to around 9,000. Measured in Australian dollars, the sharemarket has almost tripled. However, Australian dollars are not worth what they were 26 years ago, which raises an important question: how much of that gain represents genuine growth in purchasing power?
One way to test this is to price the sharemarket in gold rather than dollars. When the ASX 200 was launched in 2000, the index was worth roughly six to seven ounces of gold using Australian prices at the time. Today, with the ASX 200 near 9,000 points and gold trading above AU$6,000 per ounce, the index is worth around one and a half ounces of gold.
That is a remarkable difference. The ASX 200 has almost tripled in points, yet its value measured in gold has fallen by roughly three-quarters.
The same broad result appears in the United States. At the end of 2000, it took approximately 4.84 ounces of gold to equal the level of the S&P 500. Today, it takes less than two ounces. Despite the US index rising substantially in dollar terms, its value relative to gold has fallen by more than 60%.
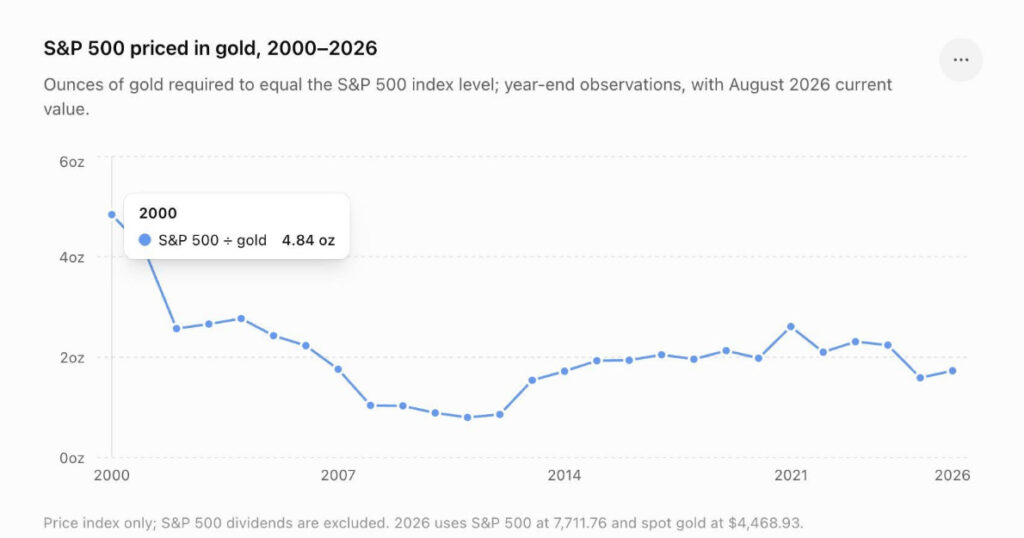
This does not mean Australian or US shares have been poor investments. Both comparisons use price indices and exclude dividends, which form an important part of long-term sharemarket returns, particularly in Australia. The starting point also matters, as 2000 followed an enormous technology-driven sharemarket boom.
What it does show is that rising markets do not always tell us the full story. An index can reach record highs while the currency used to measure it steadily loses purchasing power. Gold provides a different ruler, and over this particular period, that ruler suggests gold preserved value far more effectively than the headline index numbers imply.
For Australian investors dealing with higher food, housing, energy and insurance costs, this is where the comparison becomes relevant. The real question is not simply whether an investment increased in dollars. It is whether those dollars can still buy more than they could before.
Most investment charts measure performance in dollars, but the value of a dollar changes over time. Inflation gradually reduces what each dollar can buy, which can make long-term asset growth appear stronger than it really is.
Pricing an index in gold offers another way to measure that performance. The calculation is straightforward: divide the sharemarket index level by the price of one ounce of gold. If the result falls, gold has outperformed the index over that period. If it rises, the index has outperformed gold.
This is not a complete comparison because sharemarket indices generally exclude dividends, while physical gold does not produce income. It also does not prove that gold will outperform during every period. Instead, it demonstrates why investors should consider purchasing power and not rely solely on the number of dollars an asset is worth.
This material is general information only and does not consider your financial circumstances or objectives. Markets can move in either direction, so consider the risks, conduct your own research and seek professional financial advice where appropriate.