

The latest US employment figures paint a picture of an economy that is becoming increasingly uneven. While headline employment continues to grow, the underlying data tells a different story. Healthcare, government and professional services continue to add jobs, but leisure and hospitality have suffered some of the sharpest declines, with employers becoming noticeably more cautious as consumer spending softens.
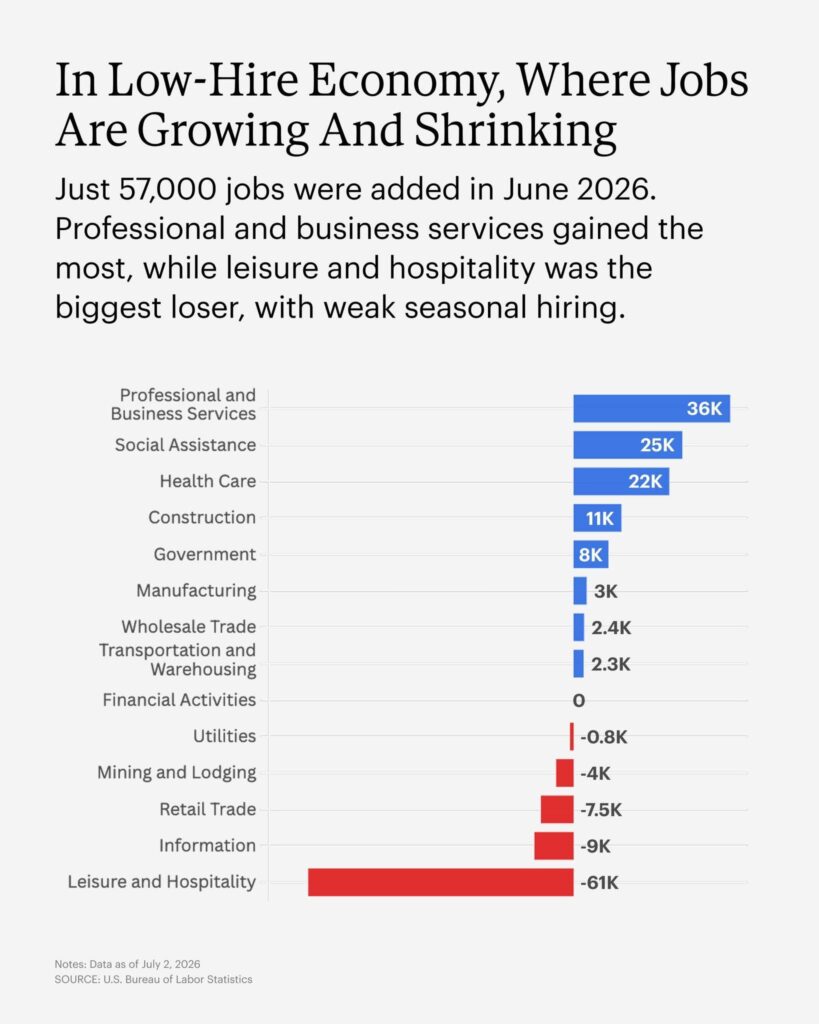
This divergence is often one of the first signs of a slowing economy. Businesses providing essential services continue hiring, while discretionary industries such as restaurants, tourism and entertainment tend to reduce staff first as households tighten their budgets. It doesn’t necessarily signal an immediate recession, but it does suggest that consumers are becoming more selective about where they spend their money.
China’s property market continues to move in the opposite direction, with prices falling to levels last seen around 2005. What began several years ago as a correction has now evolved into one of the country’s largest economic challenges, weighing heavily on consumer confidence, local government revenues and overall economic growth.
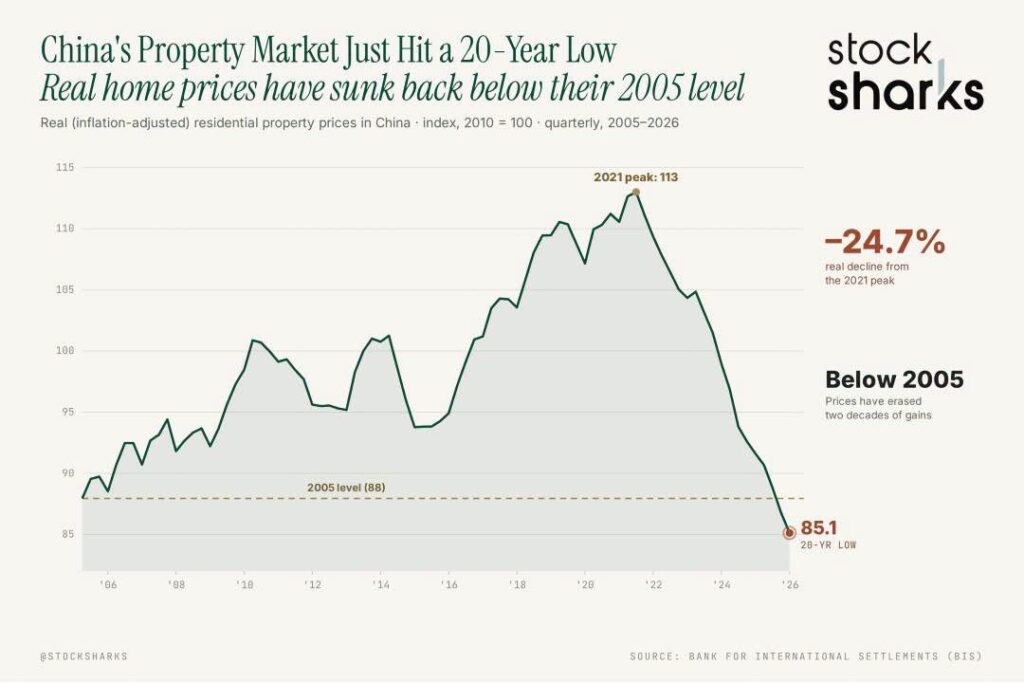
Property has traditionally been the primary store of wealth for Chinese households. As prices continue to fall, confidence across the broader economy has also weakened, reducing spending and investment. Given China’s importance to global manufacturing and commodity demand, the prolonged downturn continues to have implications well beyond its own borders, including for Australia through reduced demand for resources.
Meanwhile, precious metals finally showed signs of life after spending weeks under sustained selling pressure. Both gold and silver bounced strongly from technically oversold territory, with momentum indicators suggesting buyers have begun stepping back into the market.
While a single recovery does not necessarily confirm the start of a new upward trend, markets that become heavily oversold often experience relief rallies as bargain hunters emerge. Ongoing geopolitical uncertainty, persistent inflation concerns and slowing economic data continue to provide a supportive backdrop for precious metals, even as equity markets remain relatively resilient.
Indicators
Weekly projection STRONG SELL, Monthly projection BUY
Weekly technical indicators chart. Learn more about technical indicators and what they mean.
| Indicator | Value |
|---|---|
| RSI(14) | Sell |
| STOCH(9,6) | Sell |
| STOCHRSI(14) | Oversold |
| MACD(12,26) | Sell |
| ADX(14) | Sell |
| Williams %R | Oversold |
| CCI(14) | Sell |
| ATR(14) | Less Volatility |
| Highs/Lows(14) | Sell |
| Ultimate Oscillator | Buy |
| ROC | Sell |
| Bull/Bear Power(13) | Sell |
When analysts describe a market as oversold, they aren’t saying the asset has become “cheap.” Instead, they’re referring to technical indicators that suggest selling has become unusually aggressive.
One of the most common measures is the Relative Strength Index (RSI). An RSI reading below 30 generally indicates that selling momentum may have become excessive. This doesn’t guarantee prices will rise immediately, but it often signals that many sellers have already exited, allowing buyers to step back in.
Oversold conditions can persist for days or even weeks during strong downtrends, which is why technical indicators are best used alongside broader economic and geopolitical analysis rather than in isolation.